Signal benchmark · MNO quality · LTE/5G

See how your mobile network really performs.

SigBench is a crowdsourced signal benchmark — a network, RF and telecom benchmark that measures LTE/5G strength, quality and speed from real devices. Build live coverage maps, compare operators, and fix network problems with data, not marketing claims.

Free · Android · No sign-up. iPhone? Here's why iOS can't do RF benchmarking.

SigBench live map showing hundreds of crowdsourced signal measurements across Metro Manila
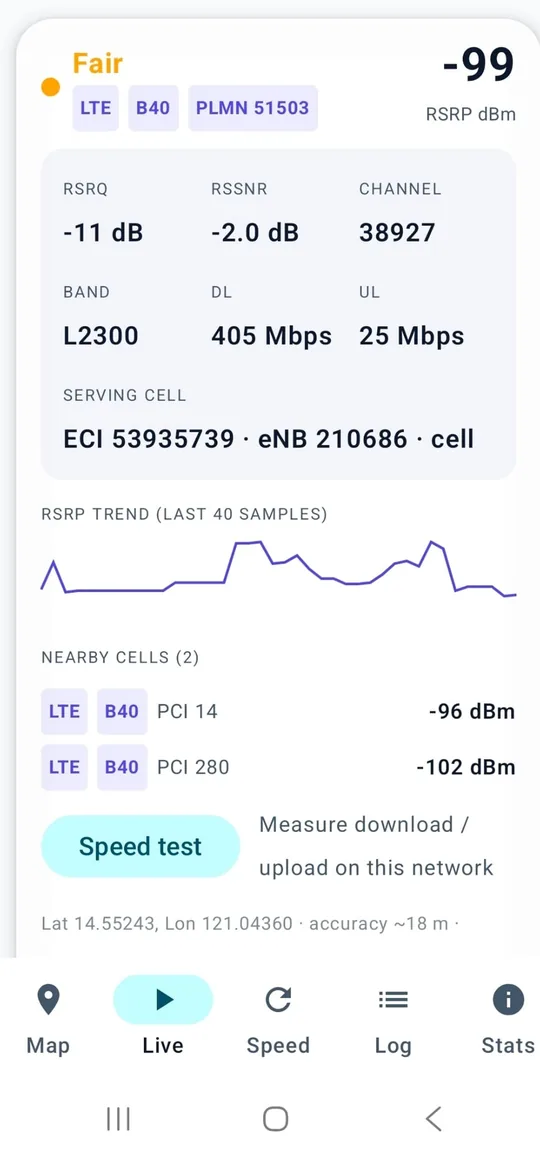
RSRP -99 dBmLTE B40
Free & no account RSRP · RSRQ · SINR LTE & 5G Live coverage maps Operator scorecards

How it works

From install to insight in three steps

No config, no test rig — just the phone in your pocket, measuring the network as you go.

Install

Download the free Android app from Google Play (or sideload the APK where Play isn't available).

Log

Turn on capture and go about your day. SigBench quietly samples LTE/5G signal and speed as you move — battery-friendly, no GPS required.

See insights

Your samples feed live coverage maps and operator scorecards. Compare networks on the same streets and spot the weak spots.

What it measures

What SigBench measures

Real radio data from real phones — the signal story marketing coverage maps leave out.

LTE/5G signal: RSRP, RSRQ, SINR

The app quietly samples LTE and 5G signal (RSRP, RSRQ, SINR), serving cells, and optional speed tests — using battery-friendly positioning, no GPS required.

Live coverage maps

Measurements aggregate into street-level hex maps and operator scorecards — see how every operator really performs where you live and work.

Better networks for everyone

Aggregated insights show where signal is weak and where towers are — evidence operators and tower companies can use to add sites where they matter.

Field surveys on Sites

Import KML, CSV, or Excel sites, fill checklists, sketch layouts, take geotagged photos, and export ZIP/PDF reports — stored on your phone for site visits. See the user guide.
See it on your phone

The app, screen by screen

Live RF metrics, a colour-coded coverage trail, built-in speed tests, dashboard sync — plus a full field-survey toolkit: compass-tagged photos, survey checklists, and bulk site import that generic signal apps don't have.

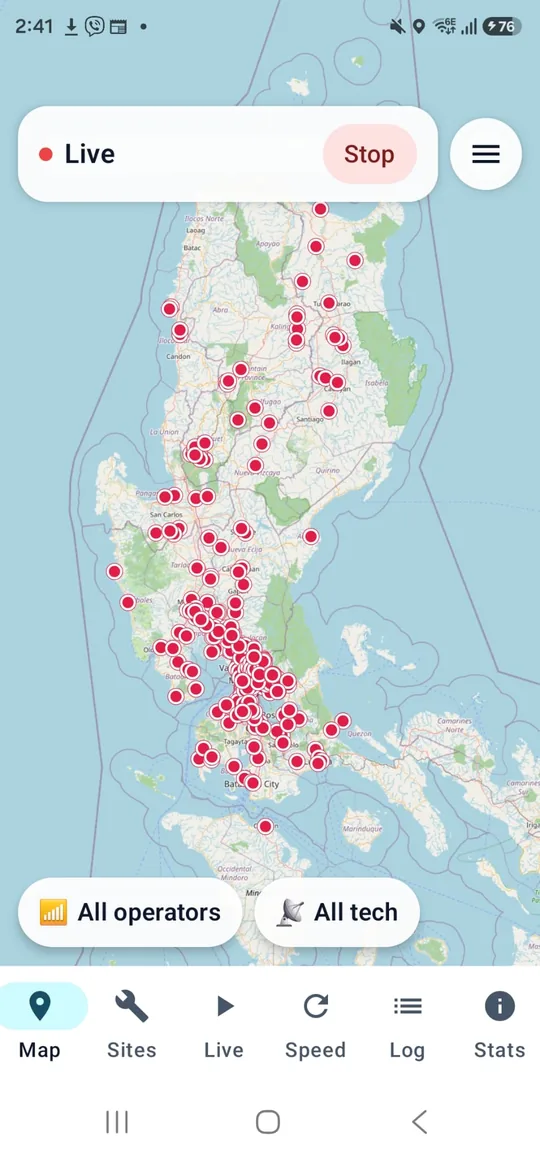
Nationwide crowdsourced measurement points across the Philippines in the SigBench app
Nationwide crowdsourced data
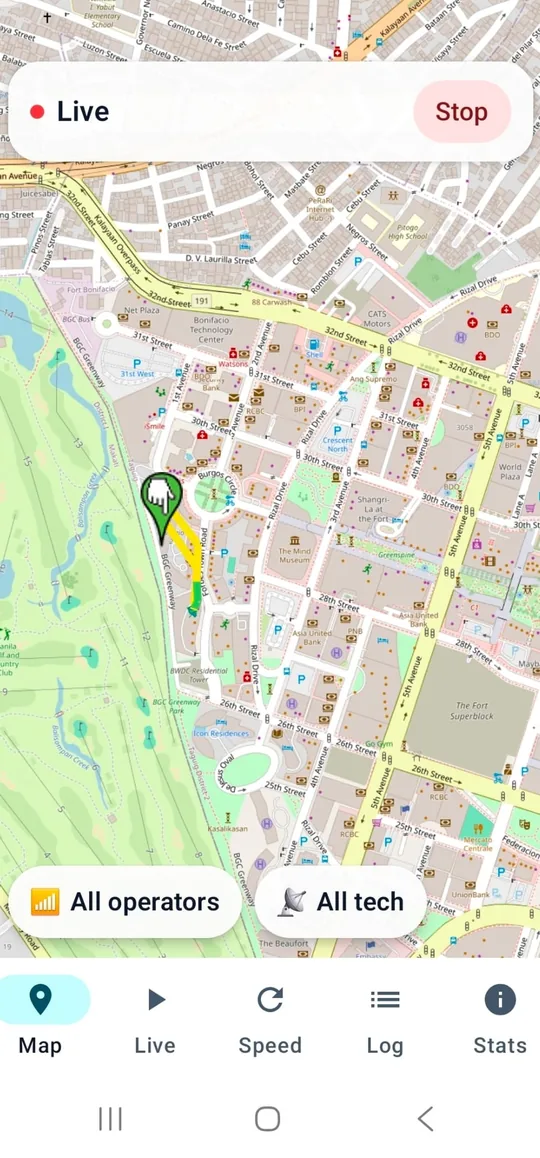
Live coverage map with signal-coloured route and operator filters
Live coverage map
Live RF metrics: RSRP, RSRQ, SINR, band, serving cell and nearby cells
RF metrics & serving cell
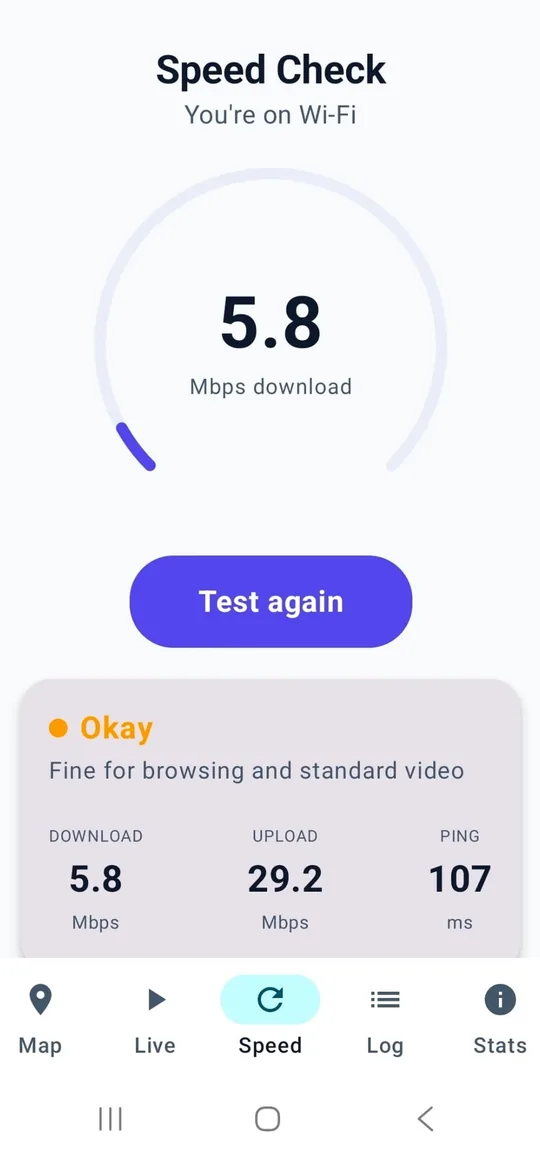
Built-in speed test showing download, upload and ping
Built-in speed test
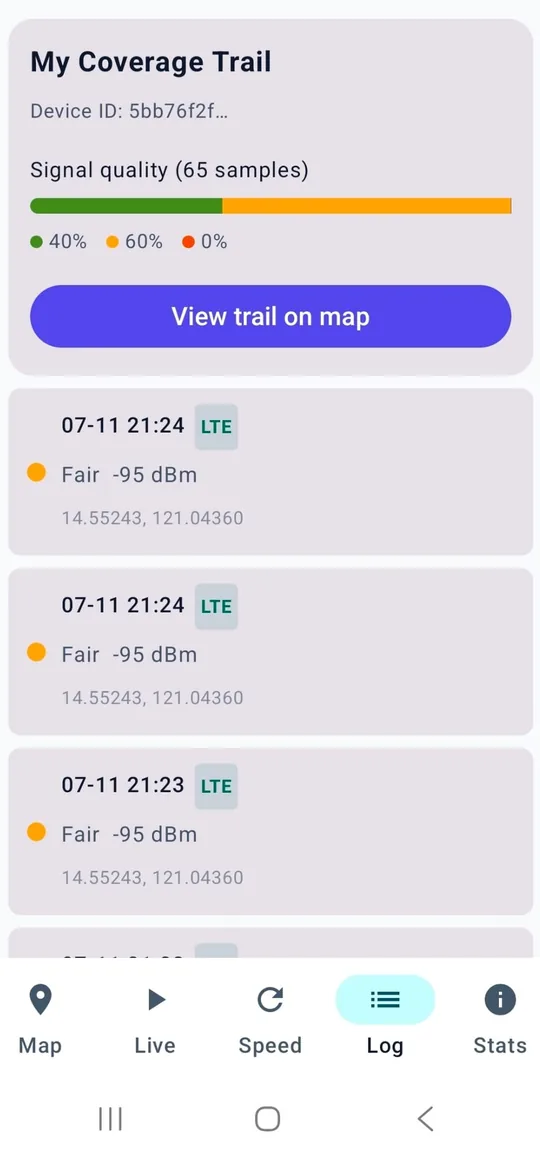
Coverage trail with signal-quality breakdown and per-sample log
Coverage trail & log
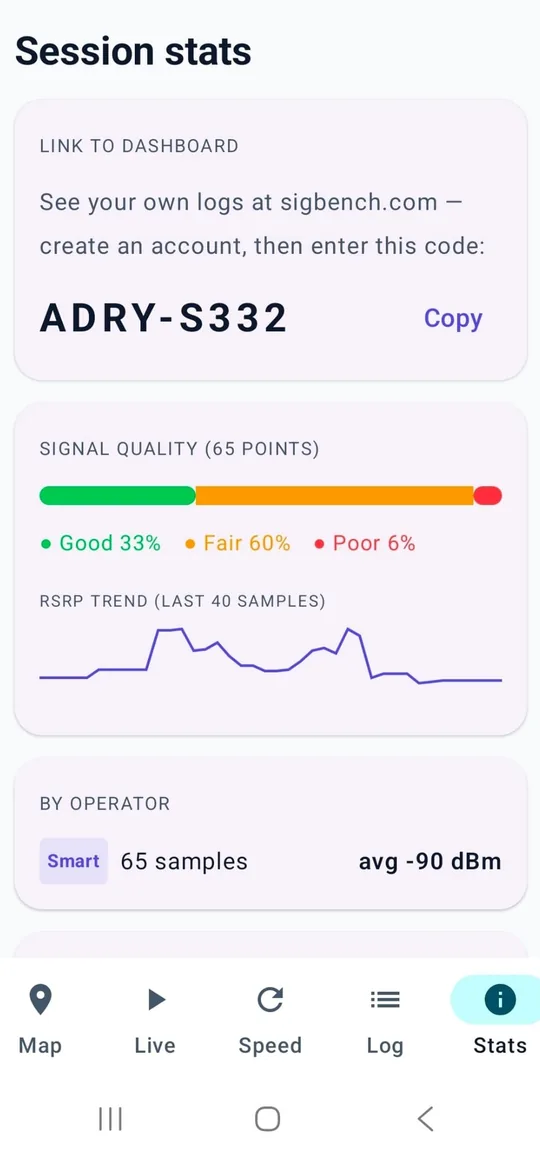
Session stats with a code that links the phone to the web dashboard
Dashboard sync
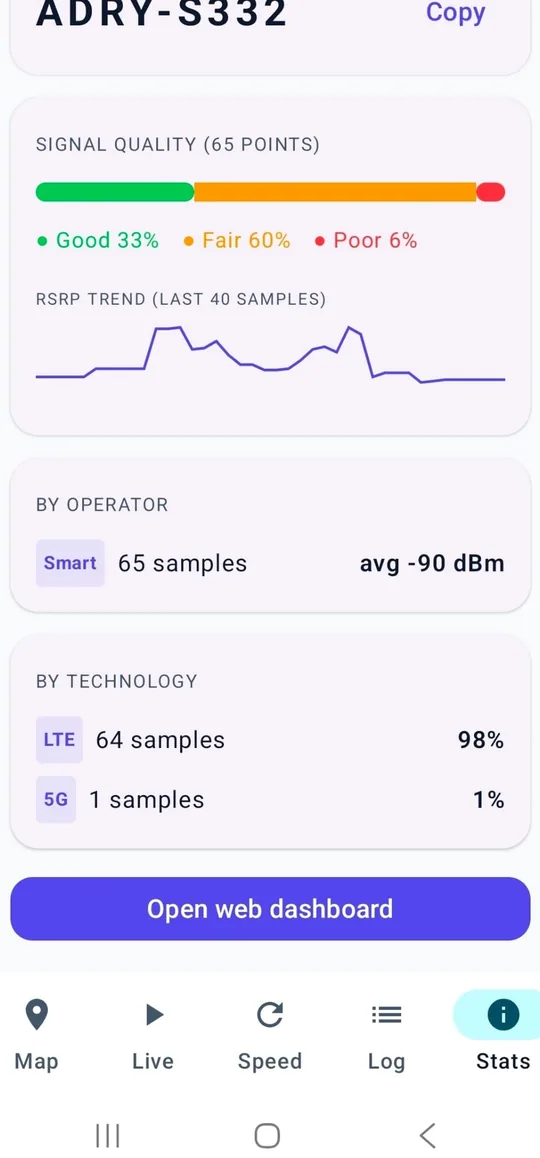
Stats broken down by operator and by LTE / 5G technology
Operator & tech split
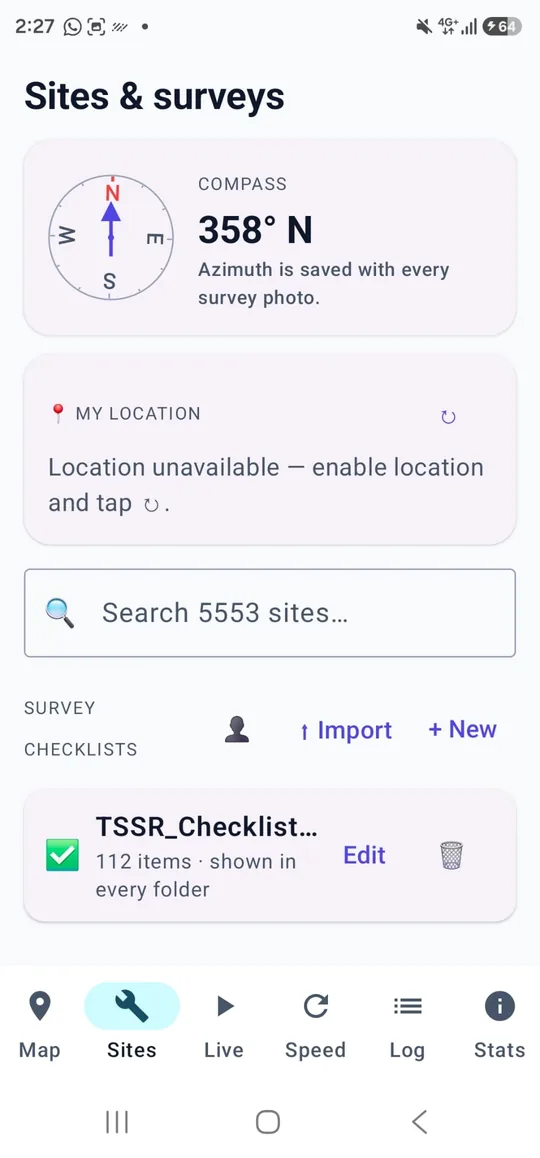
Sites and surveys tab: compass azimuth saved with survey photos and a TSSR survey checklist
Surveys & checklists
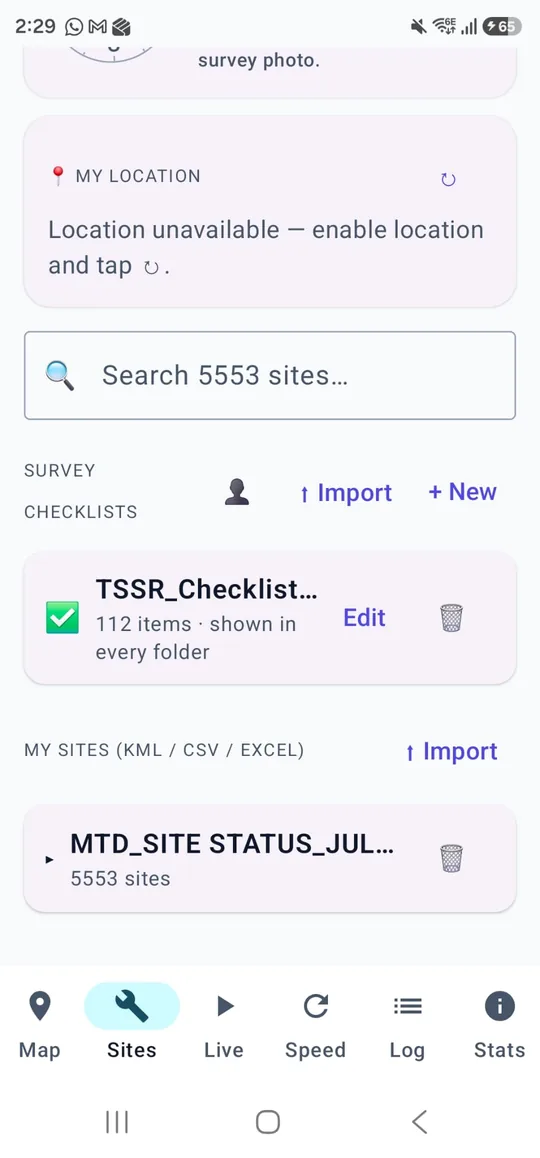
Bulk site import from KML, CSV or Excel — over 5,000 sites loaded
Bulk site import (5,000+)

Who it's for

One benchmark, three jobs

For surveyors

Professional field benchmarking — walk or drive a route, log LTE/5G, run site checklists, and export Word/PDF reports from the phone you already carry.

Field benchmarking →

For consumers

Check your real signal strength, see which operator is strongest where you live and work, and run a browser speed test — no jargon required.

Check my signal →

For operators

Data-driven network planning — crowdsourced coverage and quality evidence to prioritise new sites and validate fixes against real-world experience.

Open the dashboard →

The metrics that matter

Network, RF & MNO benchmarking for field surveyors

An MNO benchmark — also called a network benchmark, RF benchmark, or telecom benchmark — is a like-for-like comparison of mobile network operators in the same places: not a marketing claim, but measurements of radio quality and throughput. SigBench is built as an app for MNO benchmark work in the field — walk or drive a route, log LTE/5G, and compare operators on the same map.

RSRP

Reference Signal Received Power — how strong the serving LTE/5G cell is at your location. The map trail is coloured by RSRP as you move.

RSRQ

Reference Signal Received Quality — whether that power is actually usable, or drowned by interference and load from neighbouring cells.

SINR

Signal-to-interference-plus-noise ratio — a practical predictor of whether a link can sustain a decent LTE or 5G data rate.

Surveyors, rollout teams, and independent testers use it for MNO quality comparison scorecards: which operator holds RSRP, who keeps usable RSRQ, and where SINR or speed collapses indoors or at the cell edge. That's LTE benchmarking and 5G benchmarking from the phone you already carry. Read the full explainer on MNO benchmarking, LTE/5G and RSRP/RSRQ or the user guide for the field workflow.

Privacy

Your data, handled honestly

Signal & location only

Radio measurements (RSRP/RSRQ/SINR), cell and band, and each measurement's location. Never your name, number, IMEI, contacts, or call content.

Anonymous & aggregated

Data is tied to a random install ID and rolled up into coverage maps and operator benchmarks. Raw data is never sold.

You're in control

Logging only runs while you switch capture on. Stop anytime, or uninstall — collection ends immediately.

Full details in the privacy policy.

FAQ

Frequently asked questions

How do I check my RF signal?
Install the free SigBench Android app and start logging — it shows your live LTE/5G RF signal (RSRP, RSRQ and SINR), serving cell and band, and colours your route by signal strength. More on checking your RF signal.
What is network / MNO benchmarking?
A network (or MNO) benchmark is a like-for-like comparison of mobile operators measured in the same places — radio quality (RSRP/RSRQ/SINR) and speed — not marketing claims. See MNO benchmarking.
Why is my mobile signal low in my area?
Low signal usually comes from distance to the nearest cell, obstructions (buildings, terrain, indoor walls), the band in use, or network load — or simply your operator's coverage in that spot. SigBench shows your live RSRP, RSRQ and SINR and maps where signal drops, so you can tell whether it's your location, your operator, or the specific LTE/5G band — and compare mobile networks in the same area to find the strongest one.
How do I compare mobile networks or MNO signal quality?
Log the same routes on each SIM or operator and SigBench builds a like-for-like mobile network comparison — RSRP, RSRQ, SINR and speed measured in the same places. It's an objective MNO comparison and telecom operator comparison from real phone measurements, not marketing coverage maps. See how MNO benchmarking works.
Is SigBench a drive test alternative (driveless testing)?
Yes. Instead of specialist drive-test equipment, SigBench turns ordinary Android phones into crowdsourced probes — a driveless, low-cost way to benchmark RF signal and MNO quality across a city or region. It's a practical drive-test alternative for continuous coverage measurement and network benchmarking.
What is an RSRP benchmark or RSRP comparison?
RSRP is the core LTE/5G signal-strength metric (in dBm). An RSRP benchmark or RSRP comparison ranks operators or areas by measured RSRP, with RSRQ and SINR for quality. SigBench is an RF benchmark, 4G/LTE benchmark and 5G benchmark tool that records these from real devices, giving you an RF signal benchmark you can compare and map.
Does SigBench measure 5G (5G NR)?
Yes. SigBench logs 5G New Radio (5G NR) alongside 4G/LTE — SS-RSRP, SS-RSRQ and SS-SINR from the 5G synchronization signal, plus the serving NR cell (NCI), band and NR-ARFCN. You get a single 4G/5G view, so you can benchmark and compare 5G signal, quality and coverage the same way as LTE.
What do RSRP, RSRQ, SINR, CQI and the other metrics mean?
These are the radio metrics SigBench records from your phone:
  • RSRP (Reference Signal Received Power, dBm) — signal strength; the main coverage metric. Roughly: −80 excellent, −100 fair, −110+ weak.
  • RSRQ (Reference Signal Received Quality, dB) — signal quality, accounting for interference and network load; closer to 0 is better.
  • SINR / RS-SINR (Signal-to-Interference-plus-Noise Ratio, dB) — how clean the signal is; the biggest driver of achievable speed. Higher is better.
  • RSSNR (Reference Signal SNR, dB) — the LTE reference-signal signal-to-noise ratio.
  • RSSI (Received Signal Strength Indicator, dBm) — total received power including noise and interference.
  • CQI (Channel Quality Indicator, 0–15) — the link-quality index the phone reports to the network; higher allows faster modulation.
  • 5G NR: SS-RSRP / SS-RSRQ / SS-SINR — the 5G equivalents, measured on the 5G sync signal block (SSB).
  • Serving cell — operator (PLMN), cell identity (ECI on LTE, NCI on 5G), physical cell ID (PCI), tracking area (TAC), band and channel (EARFCN on LTE, NR-ARFCN on 5G).
How do I check my Wi-Fi or broadband speed?
Run the free browser broadband speed test — no app or sign-up — to check your download, upload and latency in seconds.
Is there a telecom site-survey or maintenance checklist?
Yes — import or build telecom checklists, tick items with notes, attach geotagged photos and sketches, and export a Word or PDF report. See telecom checklists.
Does it need GPS, and is it free?
SigBench is free. It uses battery-friendly positioning and works without GPS; no name, number, or account is collected.
Why isn't SigBench available on iOS?
SigBench is built for Android (Kotlin/Compose). The field RF metrics it logs — RSRP, RSRQ, cell identity, neighbour cells, and related LTE/5G survey data — come from Android telephony APIs. iOS does not expose equivalent radio or cell measurement APIs to third-party App Store apps, so an iPhone port cannot offer the same MNO / LTE / 5G survey features. On iPhone you can run the browser speed test today — no app needed.

Start benchmarking your network

Free, Android, no account. Add your phone to the crowdsourced map in a minute.